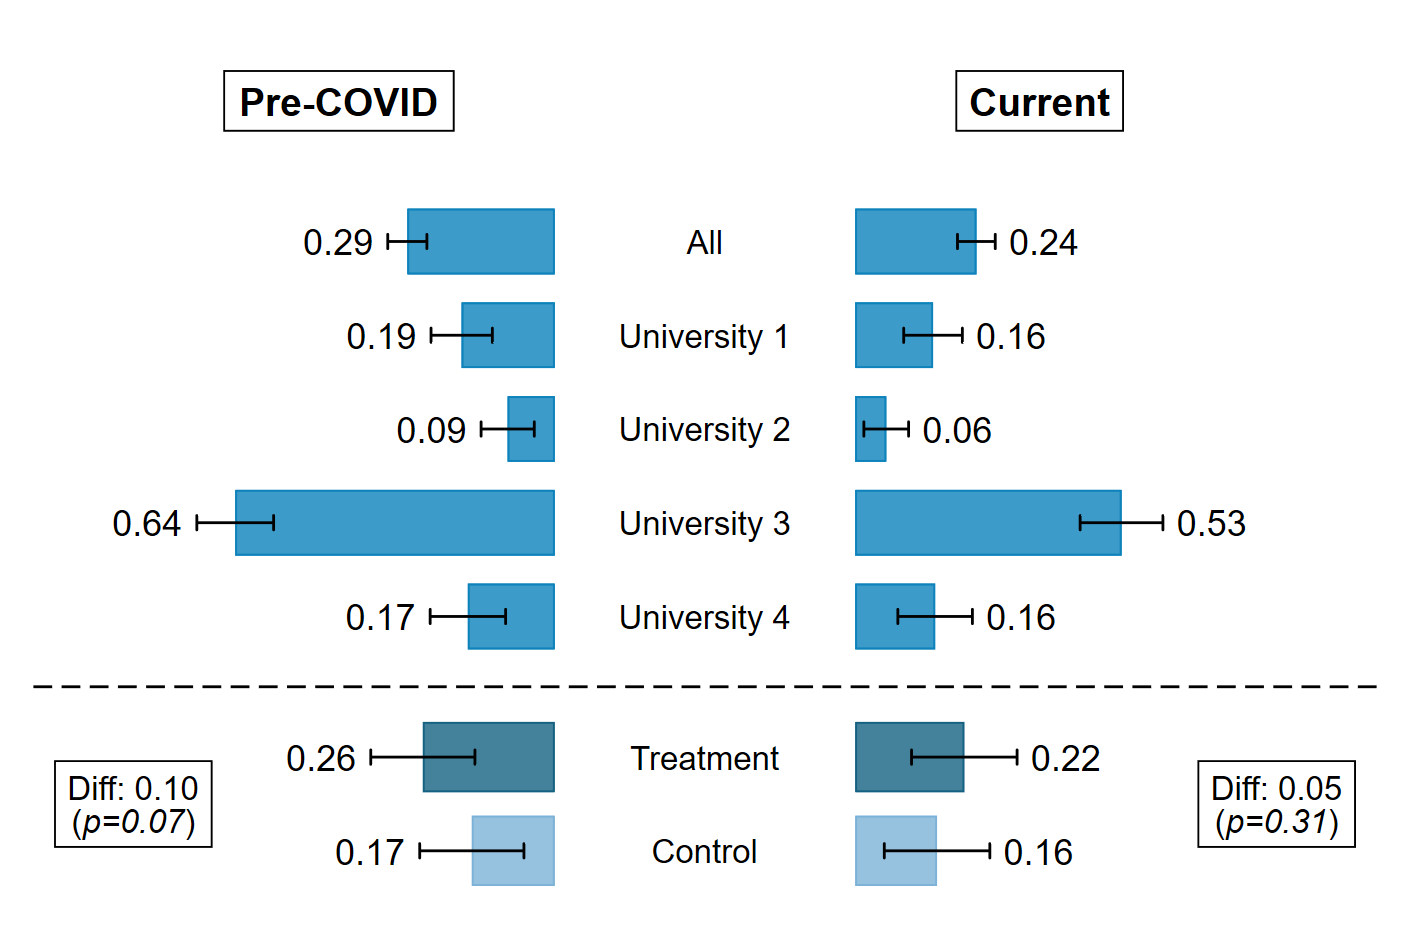
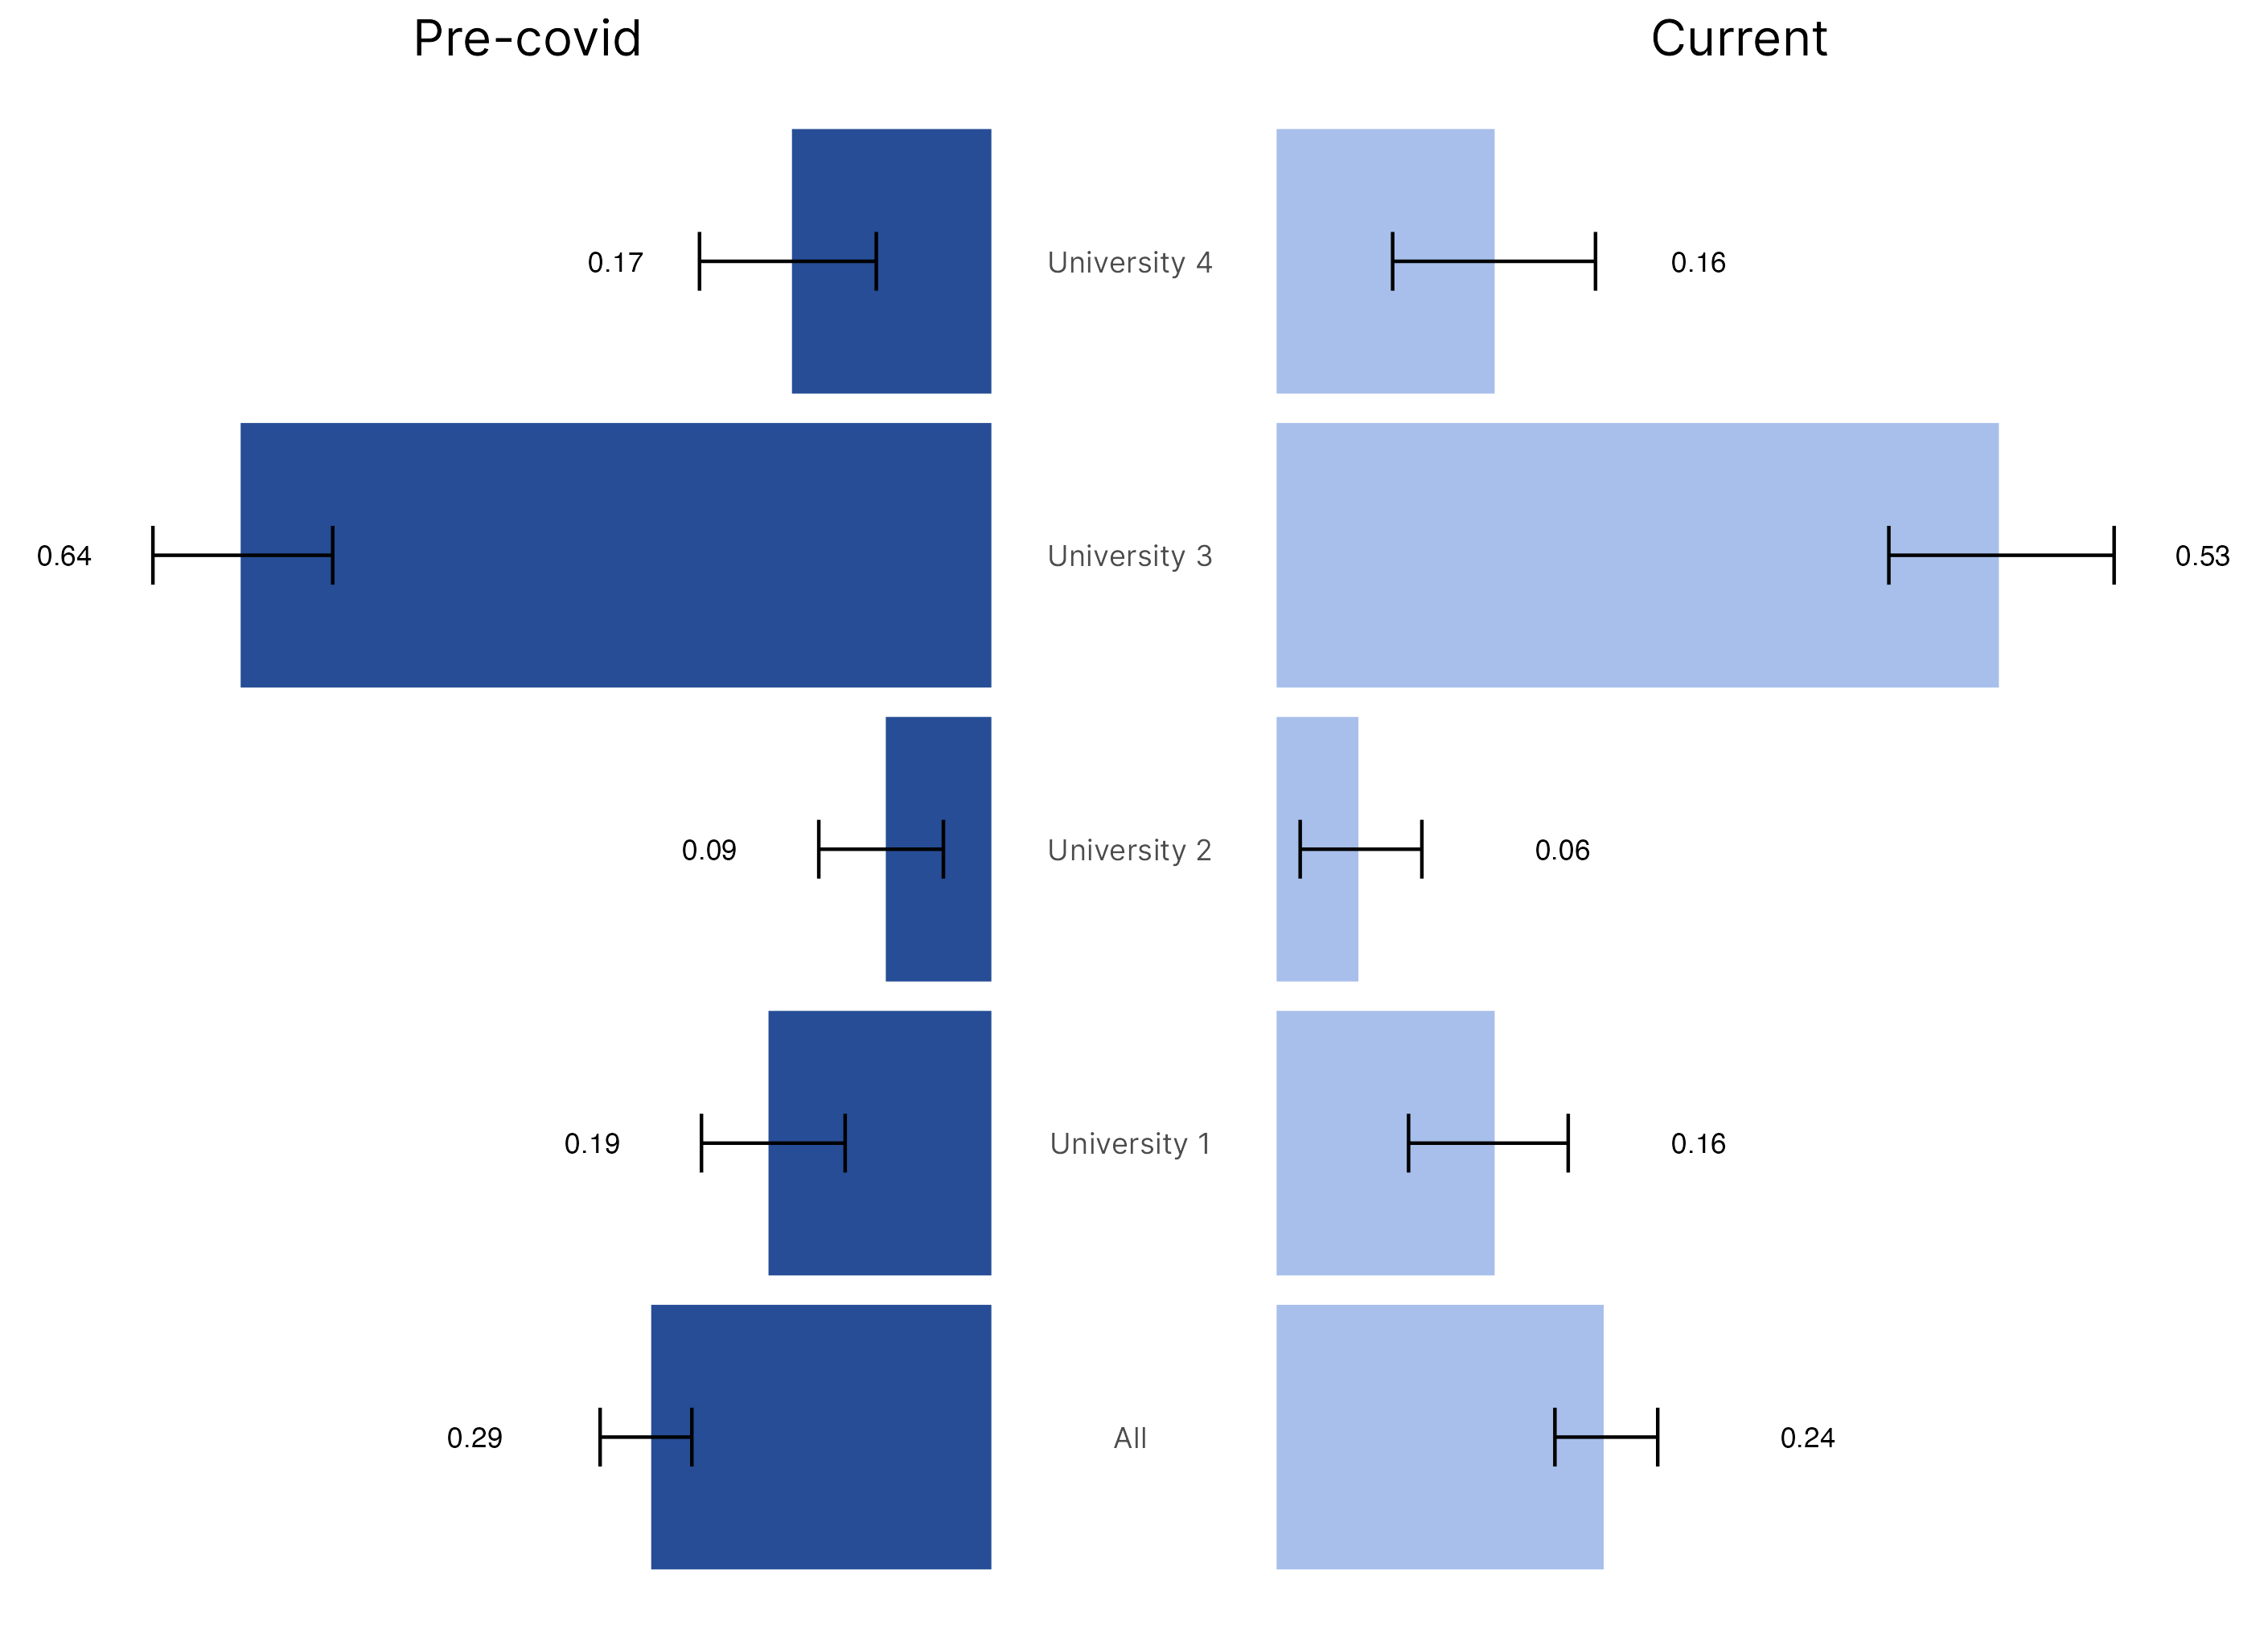
The chart
Stata

R

Data
Stata
Sample dataset can be downloaded here
R
Dataset used to create the R version of the graph can be found here.
The code
Stata
cd "C:\Users\jeffe\Dropbox (IDinsight)\Technical bootcamp online\Data Visualization\Graph examples"

* Set graph macros
global idiblue1 21 97 130
global idiblue2 13 130 187
global idiblue3 124 178 215

* Change the graph font here if you want
// graph set window fontface "Times New Roman"

* Employment status
use "IREX Data for Tornado Chart", clear

local ci_top 1

	* Create variables

		* Pre-COVID
		gen employed_jan = .
		replace employed_jan = 0 if inlist(jobNumberJan,.b,1)
		replace employed_jan = 1 if inlist(jobNumberJan,2,3,4)

		* Current
		gen employed_now = .
		replace employed_now = 0 if inlist(currentJobNumber,.b,2)
		replace employed_now = 1 if inlist(currentJobNumber,1,3,4,5)

		* Save current dataset
		tempfile working_data
		save `working_data', replace

	* Collapse by university
	recode universityAttended (0=4)
	collapse (mean) mean_jan=employed_jan mean_now=employed_now (semean) semean_jan=employed_jan semean_now=employed_now, by(universityAttended)
	tempfile uni_sample
	save `uni_sample', replace

	* Collapse by treatment group
	use `working_data', clear

		* Calculate means & CIs for treatment groups
		// Need to do this separately from collapse to account for control variables in regression
		gen treatment = .
			replace treatment = 1 in 1 // Control
			replace treatment = 2 in 2 // Treatment

		* Calculate means & SEs for Pre-COVID & Current separately
		foreach t in jan now{

			gen mean_`t' = .

			* Control mean (in row 2)
			mean employed_`t' [iweight=cem_weights_final] if participate_treat == 0
			replace mean_`t' = _b[employed_`t'] in 1

			* Treatment mean (in row 1)
			local m_covars m_female m_father_college m_mother_college m_age2020 m_engineering_tech m_education m_business_econ
			reg employed_`t' participate_treat `m_covars' i.universityAttended##i.graduationYear [iweight=cem_weights_final], robust
			replace mean_`t' = mean_`t'[1] + _b[participate_treat] in 2
			gen semean_`t' = _se[participate_treat] in 1/2
			local treat_eff_`t' = _b[participate_treat]
			local treat_eff_`t': disp %3.2f `treat_eff_`t''
			local pval_`t' = 2*(1-t(e(df_r),abs(_b[participate_treat]/_se[participate_treat])))
			local pval_`t'_round: disp %3.2f `pval_`t''
		}

		keep treatment mean* semean*
		drop if missing(treatment)
		tempfile treat_groups
		save `treat_groups', replace

	* Collapse full sample
	use `working_data', replace
	collapse (mean) mean_jan=employed_jan mean_now=employed_now (semean) semean_jan=employed_jan semean_now=employed_now
	append using `uni_sample'
	append using `treat_groups'

		* Replace universityAttended for full sample
		replace universityAttended = 0 in 1

	* Confidence interval top & bottom
	foreach t in jan now{
		gen ci_top_`t' = mean_`t' + 1.96*semean_`t'
		replace ci_top_`t' = `ci_top' if ci_top_`t' > `ci_top' & !missing(ci_top_`t')
		gen ci_bottom_`t' = mean_`t' - 1.96*semean_`t'
		replace ci_bottom_`t' = 0 if ci_bottom_`t' < 0
	}

	* Graphs

		* Flip values for January to negative (i.e. left side of graph)
		gen mean_jan_lab = mean_jan
		format mean_jan_lab %3.2f
		foreach var of varlist *jan{
			replace `var' = -`var' - 0.3
		}

		* Create bottom of rbar
		gen rbar_jan = -0.3

		* Move current values up + 0.3
		gen mean_now_lab = mean_now
		format mean_now_lab %3.2f
		foreach var of varlist *now{
			replace `var' = `var' + 0.3
		}

		* Create bottom of rbar
		gen rbar_now = 0.3

		* Flip values for universities from top to bottom
		gen bar_num = 7.5-universityAttended
		replace bar_num = treatment if !missing(treatment)

		* Graph
		twoway ///
				(rbar mean_jan rbar_jan bar_num if !missing(universityAttended), horizontal barwidth(0.7) bcolor("$idiblue2") ) ///
				(rbar mean_jan rbar_jan bar_num if !missing(universityAttended), horizontal barwidth(0.7) bcolor("$idiblue2") ) ///
				(rbar mean_jan rbar_jan bar_num if treatment == 2, horizontal barwidth(0.75) bcolor("$idiblue1")) ///
				(rbar mean_jan rbar_jan bar_num if treatment == 1, horizontal barwidth(0.75) bcolor("$idiblue3")) ///
				(rcap ci_top_jan ci_bottom_jan bar_num, horizontal lcolor(black)) ///
				(rbar rbar_now mean_now bar_num if !missing(universityAttended), horizontal barwidth(0.7) bcolor("$idiblue2") ) ///
				(rbar rbar_now mean_now bar_num if !missing(universityAttended), horizontal barwidth(0.7) bcolor("$idiblue2") ) ///
				(rbar rbar_now mean_now bar_num if treatment == 2, horizontal barwidth(0.75) bcolor("$idiblue1")) ///
				(rbar rbar_now mean_now bar_num if treatment == 1, horizontal barwidth(0.75) bcolor("$idiblue3")) ///
				(rcap ci_top_now ci_bottom_now bar_num, horizontal lcolor(black)) ///
				(scatter bar_num ci_top_jan, mlabel(mean_jan_lab) msymbol(i) mlabsize(medium) mlabcolor(black) mlabposition(9)) ///
				(scatter bar_num ci_top_now, mlabel(mean_now_lab) msymbol(i) mlabsize(medium) mlabcolor(black) mlabposition(3)) ///
				, ///
				text(7.5 0 "All") ///
				text(6.5 0 "University 1") ///
				text(5.5 0 "University 2") ///
				text(4.5 0 "University 3") ///
				text(3.5 0 "University 4") ///
				text(2 0 "Treatment") ///
				text(1 0 "Control") ///
				text(9 -0.5 "{bf:Pre-COVID}", placement(w) box fcolor(none) size(medlarge) margin(small)) ///
				text(9 0.5 "{bf:Current}", placement(e) box fcolor(none) size(medlarge) margin(small)) ///
				text(1.5 -1.3 "Diff: `treat_eff_jan'" "({it:p=`pval_jan_round'})", placement(e) box fcolor(none) size(medsmall) margin(small)) ///
				text(1.5 1.3 "Diff: `treat_eff_now'" "({it:p=`pval_now_round'})", placement(w) box fcolor(none) size(medsmall) margin(small)) ///
				yline(2.75, lpattern(dash) lcolor(black)) ///
				scheme(s1color) ///
				xlabel(-1.3(0.2)1.3, nolabel) ///
				ylabel(1(1)9.5, nolabel) ///
				xtitle("") ///
				plotregion(lcolor(none)) ///
				legend(off) ///
				graphregion(lcolor(none)) ///
				xscale(off) yscale(off) ///
				xsize(6) ysize(4)
	graph export "IREX Tornado Chart.png", replace
R
# Tornado graph

############################### Initial Setup ##################################
# Install required packages if they are not already in your system
packages <- c('tidyverse',
              'patchwork')

lapply(packages, function(i) {if(!i %in% installed.packages() == T) {install.packages(i, dependencies = TRUE, repos='http://cran.rstudio.com/')}})

# Loading required packages
library('readr')
library('ggplot2')
library('patchwork')
library('dplyr')


# Setting working directory
setwd("~/Dropbox (IDinsight)/Data visualization library")

############################## Loading dataset #################################
mydata <- read_csv("Data/tornado.csv")

############################## Data processing #################################

mydata$universityAttended <- as.factor(mydata$universityAttended)
mydata$index <- 1:nrow(mydata)
mydata[0:10]

jan_lab <- data.frame(mydata[c('index','universityAttended', 'mean_jan_lab',
                               'ci_top_jan', 'ci_bottom_jan')])

colnames(jan_lab)[colnames(jan_lab) == 'mean_jan_lab'] <- 'mean_lab'
jan_lab$period <- as.factor("Pre-covid")
jan_lab$values <- -(jan_lab$mean_lab)

now_lab <- data.frame(mydata[c('index','universityAttended', 'mean_now_lab',
                               'ci_top_now', 'ci_bottom_now')])
colnames(now_lab)[colnames(now_lab) == 'mean_now_lab'] <- 'mean_lab'
now_lab$period <- as.factor("Current")
now_lab$values <- now_lab$mean_lab


now_lab
jan_lab

############################ Creating the graph ################################

# Pre-covid
plot_pc <-  jan_lab %>%
  ggplot(aes(x = values, y = universityAttended,
             fill = period)) +
  scale_y_discrete(position = "right") +
  geom_bar(stat = "identity", fill="#264D96") +
  geom_errorbarh(aes(xmin = ci_bottom_jan, xmax = ci_top_jan), height = 0.2) +
  geom_text(aes(label = mean_lab), nudge_x = -.15,size = 3) +
  ggtitle("Pre-covid") +
  theme_classic() +
  theme(text = element_text(family = "Inter"),
        legend.position = "none",
        axis.line = element_blank(),
        axis.text = element_blank(),
        axis.title=element_blank(),
        axis.ticks=element_blank(),
        panel.border = element_blank(),
        plot.background=element_blank(),
        plot.title = element_text(hjust = 0.5, size = 15),
        plot.margin = margin(0,0,0,0))

plot_pc

# Current
plot_cur <- now_lab %>%
  ggplot(aes(x = values, y = universityAttended,
             fill = period)) +
  scale_y_discrete(position = "left")+
  geom_bar(stat = "identity", fill= "#A8BFEB") +
  geom_errorbarh(aes(xmin = ci_bottom_now, xmax = ci_top_now), height = 0.2) +
  geom_text(aes(label = mean_lab), nudge_x = .15, size = 3)+
  ggtitle("Current") +
  theme_classic()+
  theme(
    text = element_text(family = "Inter"),
    legend.position = "none",
    axis.line = element_blank(),
    axis.text.x=element_blank(),
    axis.title=element_blank(),
    axis.ticks=element_blank(),
    panel.border = element_blank(),
    plot.background=element_blank(),
    plot.title = element_text(hjust = 0.5, size = 15),
    axis.text.y.left = element_text(hjust = 0.5),
    plot.margin = margin(0,0,0,0))

final_plot <- plot_pc + plot_cur
final_plot

############################# Saving and exporting #############################
#indicating the export folder and the image file name
export_folder <- "R/Bar graphs/Exports/"
img_name <- "tornado_R.png"
ggsave(paste(export_folder, img_name, sep = ""))
Other details
R
Code written by Sandra Alemayehu.
Colors for the graph have been selected from IDinsight’s brand guide.